Making Power Observable: Fault-Managed Power as an Intelligent Layer of the Network
How a live Cisco Splunk energy dashboard at Cisco Innovation Labs Spain brings electricity and network operations together
In our previous articles we introduced Fault-Managed Power (FMP) and the joint Cisco and Panduit demo stand at Cisco Innovation Labs Spain, where a Catalyst 9300 switch and its PoE devices run on Class 4 power. This time we look at what happens after the power is delivered: what it means when every watt in the installation becomes visible, measurable and part of the same operational picture as the network itself.
Electricity has always been a separate domain
For decades, the electrical installation has lived in its own world. It is designed, installed, maintained and operated by different teams, with different tools and, mostly, without data. A distribution board tells you little more than whether a breaker has tripped. Problems are discovered when something stops working, and consumption is known once a month, from the utility bill. Meanwhile, the network running alongside it has become one of the most instrumented systems in any building.
One platform for watts and packets
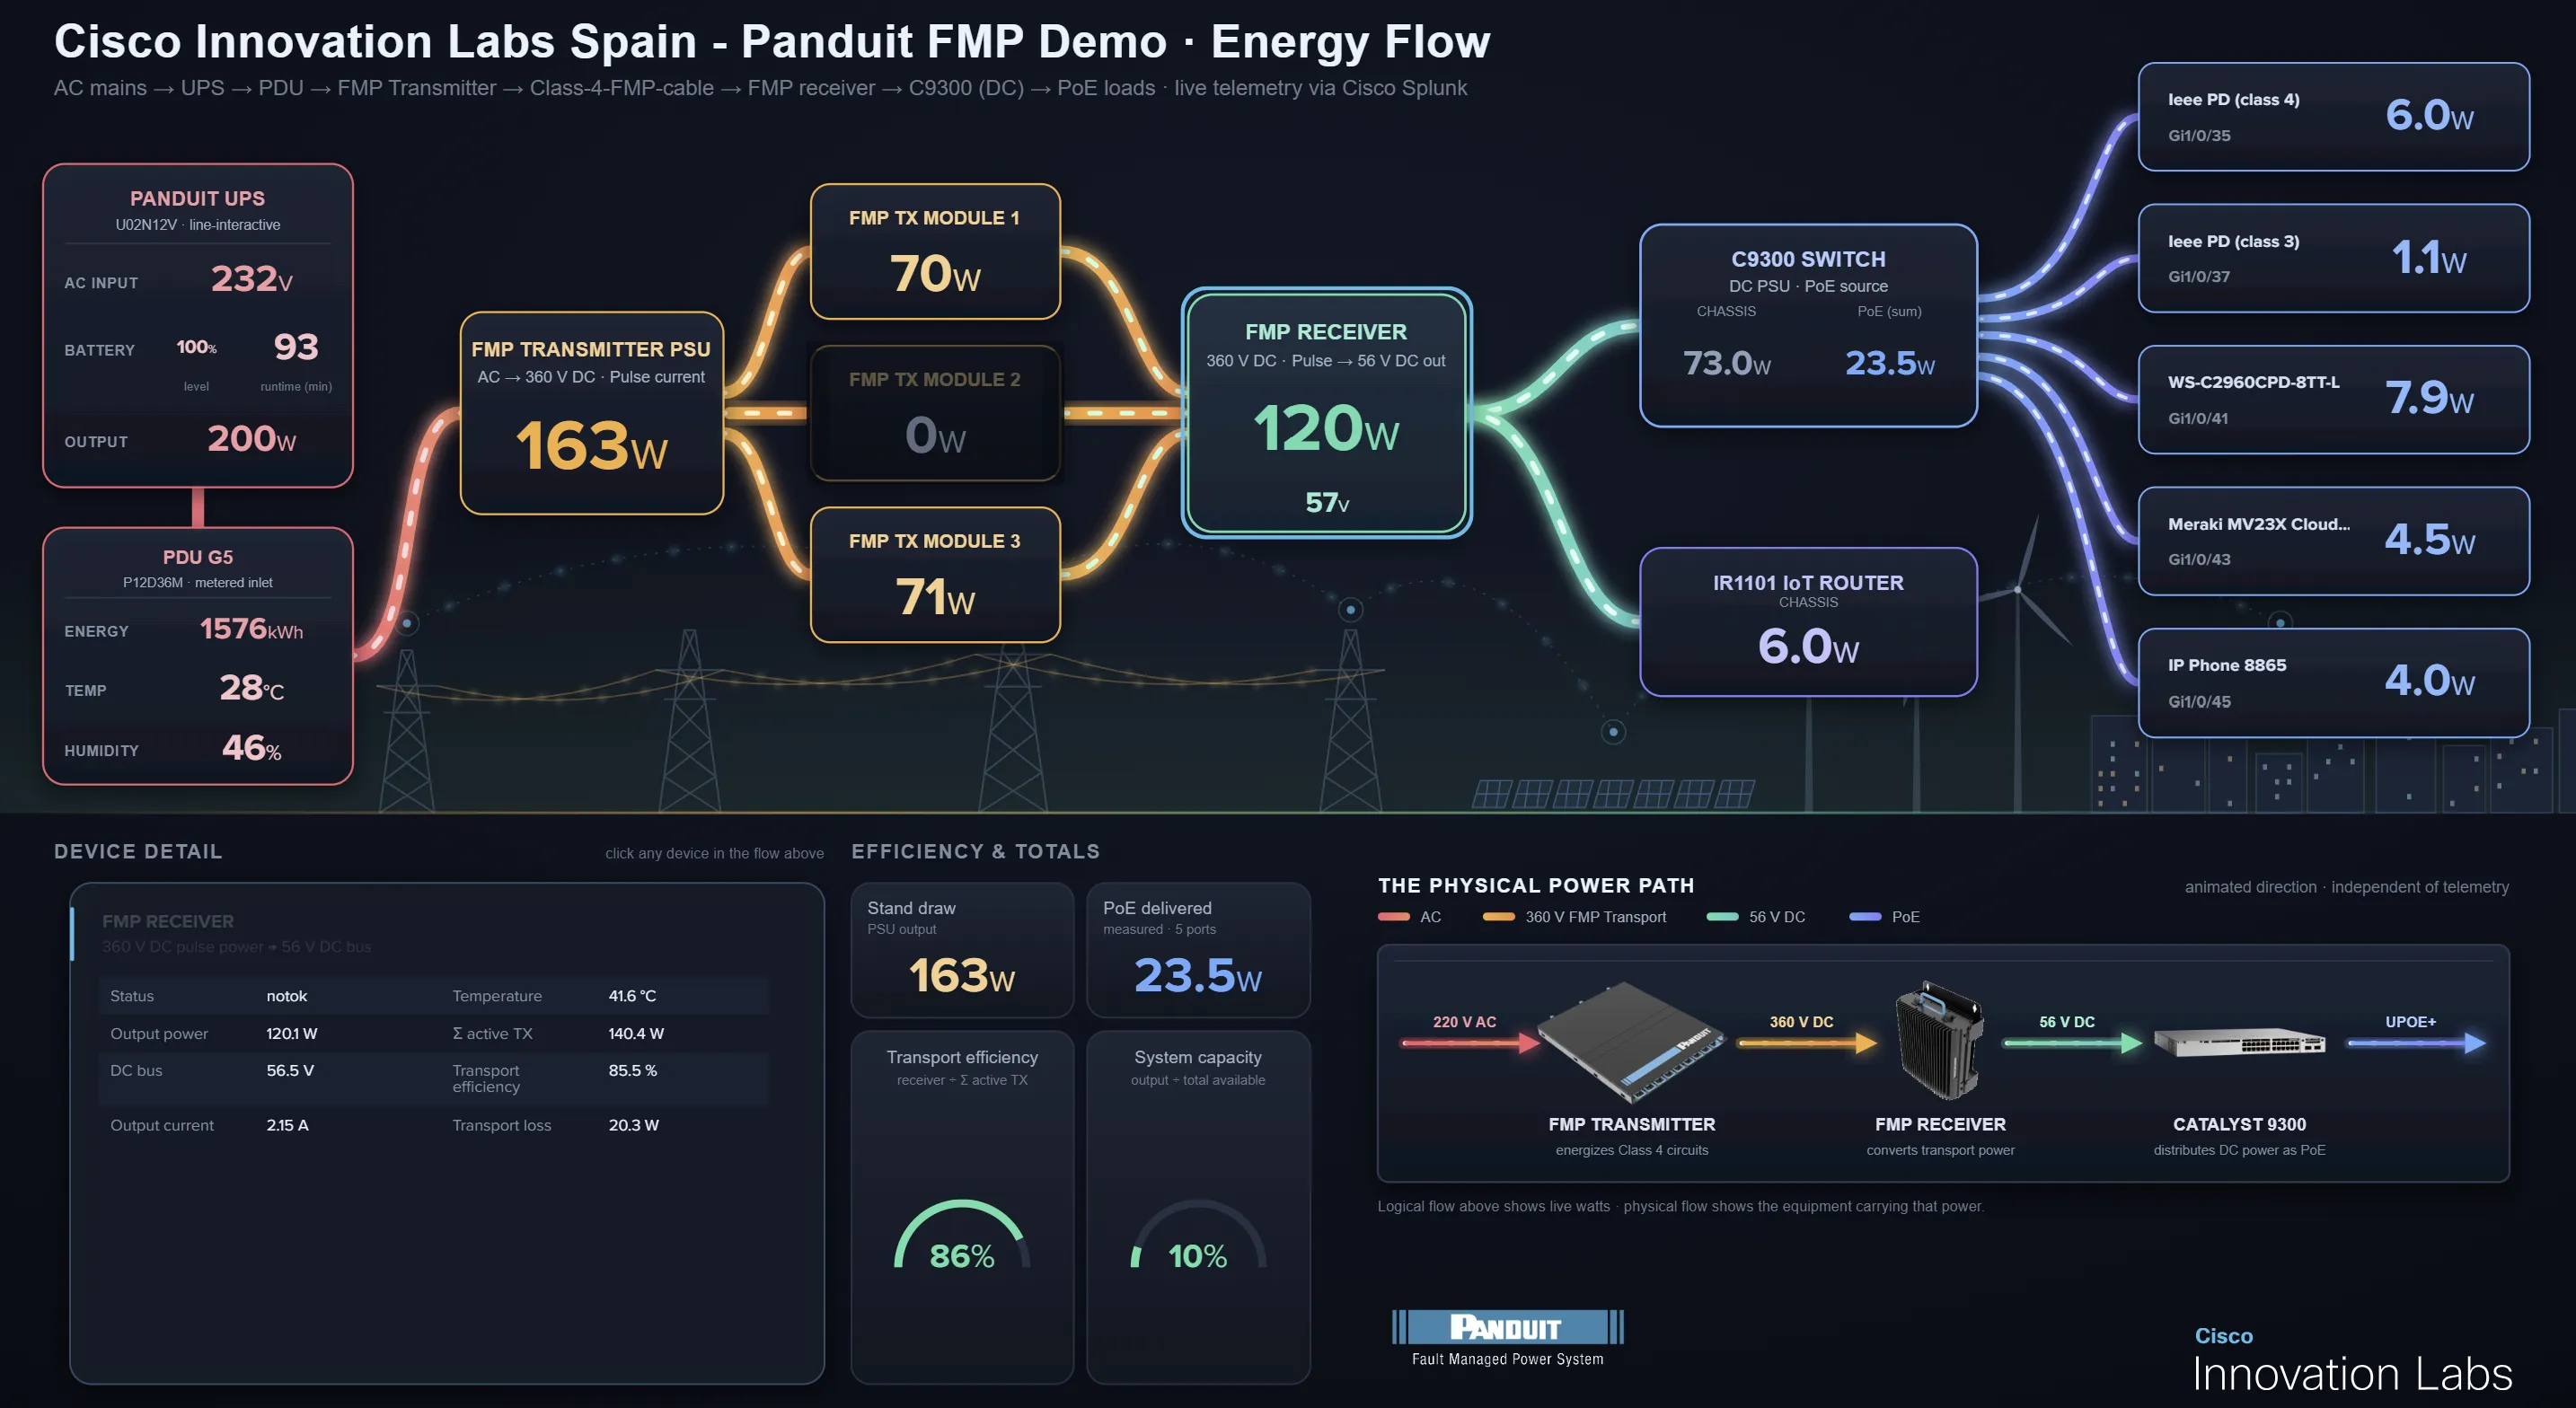
FMP changes this starting point. The transmitter, the receiver and the equipment they power are digital, connected devices. Our demo takes advantage of that by bringing the entire power chain into Cisco Splunk, the same platform Cisco customers already use for network, security and IT observability. Behind the dashboard, telemetry is collected every minute:
• Panduit power chain: the UPS, intelligent PDU and FMP system report voltage, power, energy, battery and environmental data over SNMPv3, through Splunk Connect for SNMP.
• Cisco network: the Catalyst 9300 and IR1101 industrial IoT router are read over RESTCONF, providing the switch’s real consumption, measured power per PoE port and the name of each connected device.
• One destination: both streams land in Splunk Cloud, in dedicated energy indexes, ready to be combined with any other operational data.
• Secure by design: encrypted protocols end to end and read-only collectors that never change device configuration.
We store the raw measurements as they are and calculate other indicators such as efficiency, cost or CO₂ based on the captured raw data. If the electricity tariff or the grid’s carbon factor changes, every report, including historical ones, simply recalculates with the new values.

Figure 1: Live energy-flow dashboard in Cisco Splunk, from the AC mains to every PoE device, refreshed every minute.
Following every watt
Traditional metering stops at the building entrance or, at best, at the electrical panel. Here, measurement follows the energy along its entire path: from the grid and the UPS, through the FMP transmitter and the Class 4 cable, into the Cisco 9300 switch and out to each individual device on each port. At every step we know how much power goes in, how much comes out and whether something is lost.
That level of detail changes what is possible. Seeing every watt means knowing which device consumes what, how efficiently energy is transported and how much capacity remains. Understanding every watt means putting that data in context: comparing hours, loads and sites, and spotting what deviates from normal. And because the switch that delivers PoE is also a programmable network device, acting on every watt becomes realistic: powering down a port outside business hours, prioritizing critical loads while running on battery, or planning a new device against real headroom instead of nameplate estimates.
More than a dashboard: an intelligent electrical layer
The visualization is only the visible part. The deeper change is in who sees the data and what they can do with it. Power information no longer sits in a separate building-management tool that only facilities teams open. It lives in Cisco Splunk, next to the network, security and application data that IT operations teams already watch every day. The same people, processes and tools that run the network (alerts, dashboards, incident workflows and AI assistants) can now look after the electrical installation as well. That opens possibilities that were not available before:
• Correlation: a transmitter module event, a temperature rise in the switch and a PoE device going offline can be seen as one incident, not three tickets in three departments.
• Prediction: trends in load, temperature, battery health and grid disturbances absorbed by the UPS become early warnings instead of post-mortems.
• Efficiency and sustainability: consumption per circuit, per switch and per device makes efficiency measurable and sustainability reporting based on real data rather than estimates.
• Automation and AI: once energy is a signal in the same platform, the analytics and AI-driven operations already applied to the network can be applied to power, detecting anomalies, recommending actions and, through PoE policy, adjusting loads on demand.
To put it simply, electricity starts to behave like an intelligent system running on top of the network you already operate.
From smart buildings to data centers
Combined with FMP’s own strengths (touch-safe operation, faults isolated in milliseconds and long-distance DC distribution), this convergence points to energy environments that are more reliable, more efficient, easier to manage and safer. It applies to industrial sites and smart buildings today, to residential setups tomorrow, and it is a future-proof foundation for data centers, where DC architectures and AI workloads make every watt count.
At Cisco Innovation Labs Spain this is not a slide: it is running live. Contact us to schedule a visit and see it for yourself.
No comments yet